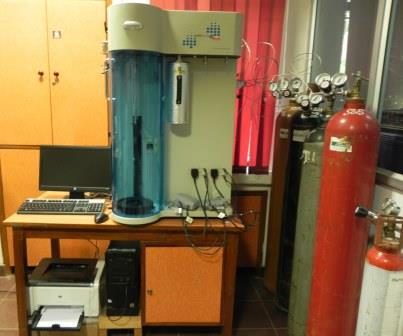
Brunauer-Emmett-Teller (BET) Surface Analyzer Facility
Location: ACMS 113
Instrument: BET Surface Area Analyzer
Model/Supplier:Autosorb I; Quatachrome Corp.
 |
Physisorption techniques are used to determine the surface area and pore structure. The system that is due for installation at ACMS characterizes samples with nitrogen gas as the standard adsorptive gas and has the versatility for analyses of materials with low surface areas using Krypton and other adsorptive gases, micropore analyses(pore radii between 5 and 15 Angstroms). The system is capable to perform automatic single-point and multi-point BET surface area, Langmuir surface area, full adsorption and desorption isotherms, and pore size and pore volume distribution. It isalso equipped with chemisorption analysis, and also, thermal programming oxidation, reduction, and desorption. |
Background
Surface area and pore size distribution are important attributes of porous materials. Typical values of the BET area for porous materials vary between 50 to 2000m2/g. Average pore-width of the activated carbon fibers is usually in the range between 2 to 50 nm, whereas that of nanofibers is less than 2 nm. The BET area analyser is equipped to provide that data on the pore volume. The average pore diameter is determined from the surface area and total pore volume. The pore size distribution(PSD) is determined based on BHJ(Barett, Joyner, and Halenda) method, which involves the area of the pore walls , and uses the Kelvin equation to correlate the relative pressure of N2 in equilibrium with the porous solid, to the size of the porous where capillary condensation takes place.
Applications
This equipment caters to the needs of the various research groups engaged in the synthesis and characterization of the porous materials , including activated carbon fibers and nano-carbon fibers, metal supported catalysts. The shape of the typical isotherm obtained for carbon fibers will provide various useful information, for example, on the large uptake of nitrogen at low P/Po indicating filling of the micropores. The linear portion of the curve represents multilayer adsorption of nitrogen on the surface, and the concave upward portion of the curve represents filling of meso-and macropores. An entire isotherm is needed for one to calculate the pore size distribution of the material.
CONTACT
| Convener: Prof. Anish Upadhyaya ([email protected]) | Internal:7672 |
| Lab Incharge:Mr. Kamlesh Thapliyal([email protected]) | Internal:6999 |
